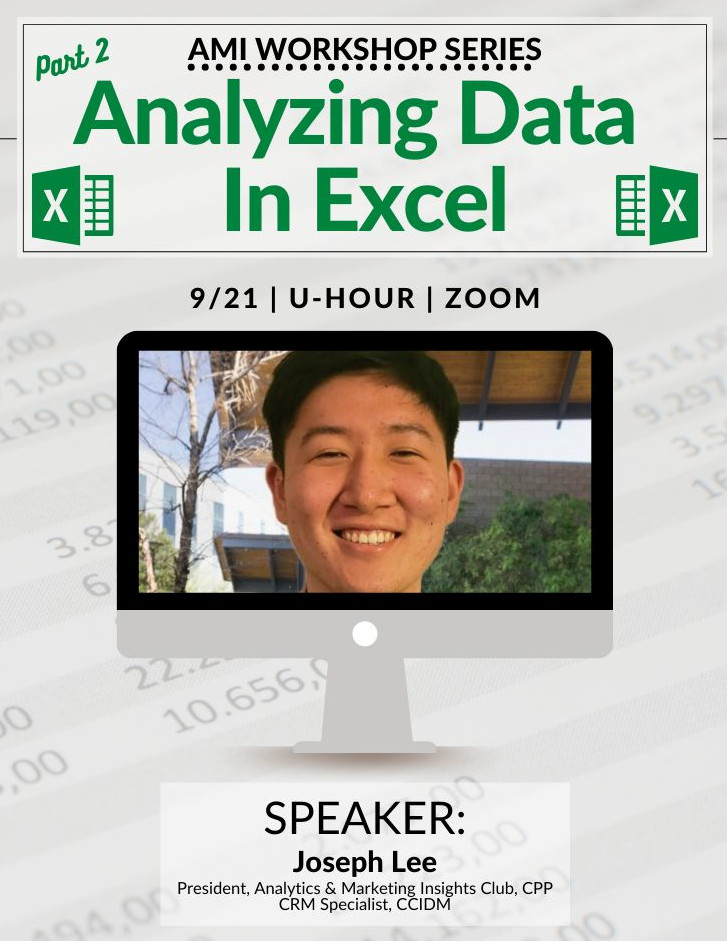
Analyzing Data in Excel
Data Analysis and Insights with Excel
This workshop is presented by the CCIDM’s Customer Relationship Management Specialist Joseph Lee on data analysis and insights using Microsoft Excel. In this video, he provides live tutorials on what cleaning, analyzing, and visualizing data looks like in Excel, shows how to clean and transform data into insights to create value using Excel tools, and aims to display the various real-world applications of the Excel functions and features.
Click here for the Excel data file to follow along!
Learning Outcomes
- Recognize the basic data analytics cycle
- Implement Excel Commands to clean, analyze, and visualize data
- Apply new skills on various data sets
- Execute analytical skills needed for almost any job (market researchers, data analysts, teachers/professors, managers, etc…)
Check below to view the video!

Relevant Links and Code:
https://www.microsoft.com/en-us/microsoft-365/excel
https://www.linkedin.com/in/joseph-c-lee/