Past Projects

American Homes 4 Rent: Analysis of Rental Properties Maintenance Data (AY 2022-2023)
American Homes 4 Rent (AMH), which focuses on single-family rental homes, is interested in analyzing the maintenance data for its homes to generate insights into the associated costs and to predict upcoming maintenance events. This project aims at analyzing maintenance in 3 major categories: 1) HVAC, 2) plumbing, and 3) roofing. The project goals are to derive insights based on an analysis of the work orders in each of these categories, and to predict upcoming maintenance work orders for any given home for the next 12 months based on its attributes (e.g., the age of the property and its location) and the work orders history.
Student team: Chris Carvalho, Karen Chu, Hunter Donnan, Giang Nguyen, Tyler Rich
Faculty advisor: Mohammad Salehan
Boeing Text Mining Project: Using Machine Learning to Derive Insights from Aircraft Maintenance Records (AY 2022-2023)
The Center for Innovative Analytics continues its partnership with the Boeing Company on analytics projects related to aircraft maintenance data. The goal is to extract object, defect, and location information from the free-form maintenance records provided by Boeing. Students are training a machine learning model based on BERT (Bidirectional Encoder Representations from Transformers) for natural language processing. Data visualizations are used to generate insights on the most frequent defects and the parts and locations in which they happen.
Student team: Giang Nguyen, Nhi Nguyen, Nicholas Schlesinger, Phuong Truong, Libin Varughese
Faculty advisors: Mohammad Salehan, Mehrdad Koohikamali, Rita Kumar
City of Pomona: Rental Affordability & Tenant Protection Strategies Project (Spring 2023)
The Singelyn Center continues its partnership with the City of Pomona on community solutions for Pomona’s homelessness. During Spring 2023, the project’s focus is on rental affordability and tenant protection strategies, with the context of Pomona’s recent rent stabilization ordinance. The project team is analyzing trends and patterns related to rental market variables, household demographic and socio-economic characteristics, rental affordability, and evictions. The ArcGIS Solutions – Social Equity Analysis tool is used to enhance the analysis and identify areas where rental affordability may be most threatened and proactive measures most impactful.
Student team: Marvin Alvarado, Andrew Cornejo, Victor Miller, Dat Nguyen, Gialeny Serrano, Paul Williams
Faculty advisors: Anthony Orlando, Rita Kumar
Meta Reality Labs: Retail Store Segmentation and Inventory Policies (Spring 2023)
Meta Reality Labs creates technologies for more connected and collaborative environments such as Augmented Reality (AR) and Virtual Reality (VR) hardware, software, and content. The Singelyn Center is partnering with Meta Reality Labs on a case study project in supply chain analytics. The project goals are to segment US retail stores and develop inventory stocking policies to maintain desired service levels.
Student team: Raquel Espiritu, Anh Nguyen, Monika Raghuvanshi, Jesus Sanchez, Minh Vong, Hua Yang
Faculty advisors: Rita Kumar, Mehrdad Koohikamali, Honggang Wang
University Advancement: Engagement and Philanthropic Giving (AY 2022-2023)
The Singelyn Center continues its collaboration with Cal Poly Pomona University Advancement. The project goal is to model the relationship between engagement with and philanthropic giving to Cal Poly Pomona. This will help University Advancement inform and prioritize engagement activities, identify prospects for follow up, and develop an engagement scoring system as a key metric. The focus of the 2022-2023 project is on the College of Business Administration.
Student team: Paolo Baluyot, Diana Diaz, Sanjay Bharati Kajool, Giang Nguyen
Faculty advisors: Alireza Yazdani, Rita Kumar
City of Pomona Homeless Community Resources and Services Project
The Center for Innovative Analytics is in a partnership with the City of Pomona on an analytics project related to homelessness in Pomona. The project goals are to analyze data to understand patterns and trends, map homeless community resources and services, and identify locations that would benefit from resources. The project uses Geographic Information Systems (GIS) tools for web mapping and app development. Dr. Rita Kumar, Dr. Anthony Orlando, and Dr. Mehrdad Koohikamali serve as faculty advisors to the interdisciplinary student team.
Story MapCity of Pomona: Community Solutions for Pomona’s Homelessness
The Singelyn Center continued its partnership with the City of Pomona on community solutions for Pomona’s homelessness. During 2021-2022, the project team completed two phases of the project. In phase 1, they created a resource guide, mapping resources in various categories of service and including Covid-19 vaccine location sites. In phase 2, they developed strategic planning dashboards, based on analysis of data from the city as well as publicly available data, to highlight key indicators including individuals served by the range of programs offered in Pomona. Dr. Anthony Orlando and Dr. Rita Kumar serve as faculty advisors to the student team.
Boeing Image Classification Mobile Application Project
The goal of this project was to develop a mobile app that can identify different types of objects including a 3D-printed mockup provided by Boeing. Two teams of students worked on this project, with Dr. Mohammad Salehan as the faculty advisor. One team focused on developing a Deep Learning (DL) image classification model while the second team developed the front end of the mobile application. The DL team successfully trained an image classification model capable of identifying 11 classes of objects. The mobile app team developed the front end as an Android mobile application capable of classifying both the camera output in real-time (Augmented Reality) and static images taken through the device camera. The app allows the user to review a list of captured images and their assigned labels and share them with others through email.
Boeing Corrosion Analytics Project
The Center for Innovative Analytics is in a partnership with the Boeing Company to work on an analytics project related to corrosion on aircraft. This interdisciplinary project includes a team of students from the College of Business and a team from the College of Engineering. The project goal is to understand the factors impacting corrosion, and deliver insights that can contribute to Boeing’s goal of controlling and preventing aircraft corrosion. Dr. Rita Kumar and Dr. Mohammad Salehan serve as faculty advisors to the College of Business student team, and Dr. Vilupanur Ravi serves as faculty advisor to the College of Engineering student team.
PCV Murcor Analytics Project
The Center partnered with PCV Murcor, a nationwide real estate valuations management company, to complete a descriptive analytics project related to real estate appraisals. Appraisals data provided by PCV Murcor was supplemented with publically available data from Zillow to provide insights related to appraisals, fees, quality, and completion times. The project was completed in Fall 2019 and included a team of students from four different departments from the College of Business. Dr. Rita Kumar and Dr. Anthony Orlando served as faculty advisors. This project was featured in the College of Business inaugural RSCA (research, scholarship, and creative activities) showcase in May 2020.


Intertrend Communications Project
The Center worked with Intertrend Communications on an analytics project to identify patterns and trends in a database along with penetration levels by geographic areas. This project incorporated GIS tools and was completed in February 2020. Dr. Mehrdad Koohikamali and Dr. Rita Kumar served as faculty advisors.
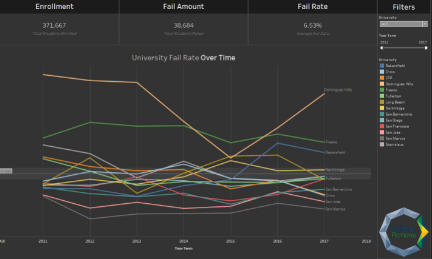
CIS Curriculum Project
A student team worked with Dr. Guthrie on analysis of the CIS curriculum across the United States. The team looked into web mining to capture data aspects of curriculum such as core courses, option names, track names, and numbers of courses required. The data mining proved very difficult and much of the data was collected by visiting College and University web sites. A curriculum dashboard was built in Tableau to visually show how CIS curriculum differs geographically. Students are experimenting with linking this data to other sources. Students also implemented a dashboard showing high drop/withdrawal/fail (DWF) courses across Cal State University campuses.